Counting What We Save: Repair and Reuse Across the UK

Today we focus on measuring the environmental impact of repair and reuse initiatives across the United Kingdom, translating saved materials, avoided emissions, and extended product lifetimes into credible numbers that inspire action, unlock funding, and help communities prove that practical circular habits genuinely change our shared future.

From Storytelling to Evidence

Repair stories move hearts, yet evidence moves budgets. Turning anecdotes into measured outcomes links volunteer effort to carbon, waste, and water results. This shift helps charities, libraries, and community workshops demonstrate value, proving everyday acts accomplish more than goodwill, and inviting more residents, funders, and policymakers to participate confidently.

Choosing What to Count and Why

Start with impacts that matter locally and scale sensibly. Carbon avoided, waste diverted, and product life extension are practical, widely understood indicators. Prioritise indicators that influence decisions, align with council strategies, and are feasible to collect reliably during busy events, without overwhelming volunteers or compromising the welcoming atmosphere that keeps people returning.

A Quick Win Framework for Small Groups

Adopt a simple workflow: log item type, weight or model, fault, repair outcome, and expected added lifespan. Apply conservative emission factors, note uncertainties, and aggregate quarterly. This minimal, disciplined routine builds credible baselines, reveals trends, and gives volunteers satisfying feedback loops that show how each saved kettle or coat truly matters.

Why Measurement Powers Circular Progress

Numbers make invisible benefits visible. By connecting repaired toasters, refurbished phones, and rehomed furniture with avoided emissions, reduced waste, and preserved resources, groups across the UK can prioritise what works, persuade partners, and grow support. Transparent reporting invites trust, strengthens partnerships with councils, and fuels momentum for community-led, circular change.

Core Indicators and How to Calculate Them

Carbon Avoided, Plainly Explained

Estimate how much carbon is prevented by repairing instead of replacing. Use embodied emission factors from credible lifecycle databases or UK government greenhouse gas conversion factors, adjusted for product categories. Multiply by probability of avoided replacement and years of extended life. State uncertainty ranges clearly, preferring conservative estimates that retain stakeholder confidence.

Waste and Materials, Measured Fairly

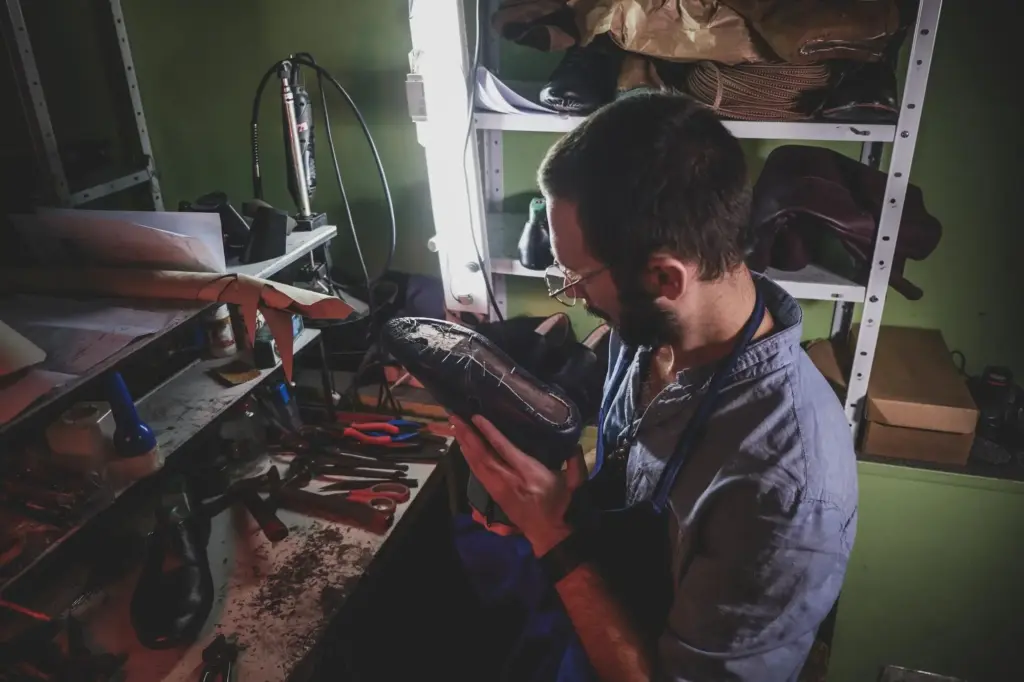
Measure the mass of items kept in use to quantify waste avoided. When precise weights are impractical, sample and extrapolate carefully across common categories like small appliances, textiles, and furniture. Track parts replaced to reflect partial material inputs, preventing inflated savings and presenting a balanced picture of genuinely avoided disposal impacts.

Water and Energy, Without Guesswork

Where robust data exist, apply water and energy intensity values for typical products, acknowledging wider uncertainty. Consider usage-phase savings only when repair improves efficiency, such as fixing seals on fridges or restoring insulation. Avoid speculative estimates, document sources, and invite peer feedback to refine methods as better UK-specific datasets emerge.

Collecting Data in Busy Community Settings

Great methods fail without practical data capture. Community spaces are lively, time-pressed, and volunteer-led. Build forms people enjoy using, keep fields lightweight, and respect privacy. Offer digital and paper options, provide quick prompts, and celebrate contributions so accurate logging becomes part of the friendly ritual rather than an administrative burden.

Friendly Intake Forms People Actually Use

Design forms that ask only what you truly need: item category, brand or model, fault, success outcome, estimated added life, and optional weight. Use simple tick boxes, conversational language, and visible QR codes for quick digital submission, so visitors and volunteers can participate confidently without slowing the welcoming, communal atmosphere.

Barcodes, Photos, and Serial Numbers

A quick photo of the label, serial number, or device inside speeds later analysis. Barcode scans help retrieve specifications like weight and energy class. Encourage consented photos of repaired items, never personal images unless agreed. These small habits turn chaotic tables into robust datasets that still respect warmth, dignity, and privacy.

Training Volunteers in Ten Minutes

Equip greeters with a short script, laminated examples, and a cheerful checklist. Practise one mock intake, one tricky case, and one refusal policy. Clarify why each field matters for impact. Volunteers become confident ambassadors, gathering cleaner data while keeping queues moving and conversations friendly during even the most popular community sessions.

Defining the Counterfactual with Care

Would the item really be replaced, or stored in a cupboard for months? Use short audience surveys and follow‑ups to estimate realistic replacement likelihoods. Recognise partial repairs and temporary fixes. Transparent counterfactuals prevent overstating benefits and align results with everyday behaviour, strengthening conversations with funders, councils, and curious neighbours alike.

Sampling When You Cannot Measure Everything

If weighing every appliance is impossible, weigh a representative sample and apply category averages. Stratify by product type and condition, and publish confidence intervals. This practical compromise respects busy events while keeping results statistically defensible, enabling consistent comparisons across hubs, seasons, and different volunteer teams with varying capacity and experience.

Open Assumptions Build Confidence

List sources for emission factors, device lifespans, and failure modes, linking to UK government guidance where applicable. Note conservative choices and explain why. Invite peer review from nearby groups or networks. Publicly share a living methods note that evolves, ensuring stakeholders can understand, replicate, and trust your reported environmental outcomes.

A Laptop in Manchester

A student’s slow laptop arrived destined for replacement. A volunteer cleaned the cooling system, upgraded RAM, and reinstalled software. The device gained three productive years. Using conservative manufacturing emission factors for laptops, the avoided impact dwarfed workshop energy use, showcasing how modest skills and minutes can unlock surprisingly large carbon benefits.

A Sofa in Glasgow

A torn but sturdy sofa reached a reuse warehouse. With reupholstery and frame tightening, it found a new home within days. Weighing the piece and applying furniture manufacturing intensity, the team logged significant waste diversion and embodied carbon preserved, while a family saved money, linking environmental results with everyday social well‑being.

Turning Results into Action and Support

Impact data should travel beyond spreadsheets. Use clear visuals, short briefs, and community updates to reach councillors, journalists, businesses, and neighbours. Translate numbers into decisions about funding, spaces, training, and partnerships. The right stories, told with credible evidence, elevate local efforts into a recognised driver of circular progress across regions.
Lumanilosentosanorinoviro
Privacy Overview

This website uses cookies so that we can provide you with the best user experience possible. Cookie information is stored in your browser and performs functions such as recognising you when you return to our website and helping our team to understand which sections of the website you find most interesting and useful.